One of the most important discoveries in finance over the past few decades is that stocks of firms that share certain fundamental characteristics called “factors” exhibit different return and risk characteristics than the overall market. Critical to investors is the fact that, over long periods of time, certain of these factors have earned excess returns compared to the overall market.
Broadly speaking, these factors can be distilled into the following categories:
- Momentum: Stocks that have exhibited positive momentum – i.e., have performed relatively well over the past 3 to 12 months have outperformed, on average, over long time horizons stocks that display negative momentum.
- Quality: Stocks that have evidenced superior profitability in relation to capital have, on average, outperformed firms with poorer profitability in relation to capital over long time horizons.
- Low Volatility: Stocks that have exhibited low volatility have, on average, outperformed stocks that display high volatility over the long run.
- High Yield: Stocks of companies that pay higher dividends, on average, have earned superior returns to lower and non-dividend paying stocks over the long run.
- Value: Stocks that are low-priced in relation to earnings, dividends, cash flow or book value, on average, have outperformed growth stocks over long time horizons.
- Size: Stocks of small and mid-size companies have earned, on average, higher returns than stocks of large companies over long time periods.
There are two primary explanations for the higher returns associated with these factors. One is that the higher returns represent risk premiums – i.e. compensation to investors for incremental risks beyond that of the total stock market. For example, small company stocks are not only more volatile than stocks of large companies but are also much less liquid. Value stocks tend to include a higher proportion of heavily indebted companies which dramatically underperform the overall market during periods of extreme market stress.
The second explanation is offered by behavioural finance. Investors’ cognitive biases such as “myopia” and “overconfidence” can lead to the persistent mispricing of certain securities. For example, many investors are attracted to the episodic outsized returns of high volatility, low quality stocks and chase these types of stocks despite a pattern of longer-term underperformance. Overly optimistic investors overestimate the earnings prospects of growth stocks while underestimating those of value stocks; value stocks then generate superior returns as investors eventually realize that earnings in the value universe are better than initially expected. The “herding” behaviour of investors has been advanced as an explanation for the returns associated with the momentum factor.
Social phenomena such as the “bandwagon effect” can also distort prices. The “madness of crowds” – as evidenced by the railway mania of the 1840’s, the Florida real estate boom of the 1920’s, the Japanese bubble of the 1980’s and the internet mania of the 1990’s – is a well-documented recurring market spectacle. Investors’ infatuation with certain extremely expensive US growth names these last several years will likely be added to the textbooks as the most recent example.
Factor performance can vary because of business cycle influences, market sentiment, interest rate changes, technological innovations, sector composition and other variables. The following chart sets out the return earned by each factor globally in 2025 compared to the overall broad market. (See Appendix I for Sources).
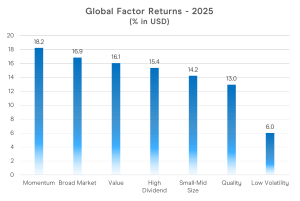
Momentum posted the highest factor return in 2025 at 18.2% and retaining top billing from the year prior, though at a far more moderate pace compared with 2024’s exceptional 44.3%. Last year, the factor only slightly outperformed the broader market which returned 16.9%. Momentum continued to be supported by ongoing investor enthusiasm for AI, strong earnings for technology companies, a bull run for commodities, and a risk-on attitude by investors throughout much of the year despite periods of volatility stemming from the new US trade regime. Broad market returns, meanwhile, benefited from easing inflation and declining global interest rates throughout the year that helped lift total market sentiment.
Value came in at a tight second with a 16.1% return in 2025, moving up from fourth place last year. Value benefited from early‑year investor optimism for pro‑business policy expectations in the US. As the year progressed, stretched valuations for large‑cap growth and technology stocks prompted investors to rotate into attractively valued companies, providing a tailwind for the factor.
As a sidenote, Tacita Capital has utilized momentum and value equity instruments as elements of a prudent broader equity approach on behalf of clients for many years.
High‑dividend stocks followed closely behind value returning 15.4% for fourth place in 2025. Investors looked to high‑dividend stocks for reliable income as interest rates moved lower over the year, reducing the appeal of cash and short‑term fixed income relative to equity income strategies. Investors also turned to high-dividend companies for stable cash flows and consistent payouts to weather bouts of macro uncertainty.
The small and mid-sized factor placed fifth at 14.2% as the momentum trade wooed investors over size in 2025. Nevertheless, Canadian investors benefited from outsized domestic small‑cap strength, supported by a robust backdrop for commodities and a surge in precious‑metals‑linked companies that helped lift local small‑cap performance above global peers.
Quality came in sixth place in 2025 with a 13.0% return, a notable step down from its second‑place finish of 30.3% in 2024. As global interest rates moved lower over the course of last year, investors rotated into more cyclical areas of the market in lieu of quality. At the same time, the factor underwent a valuation reset after several years of strong outperformance, which tempered returns. Even so, earnings resilience among large established high‑quality companies remained intact, with familiar mega‑cap names continuing to benefit from ongoing AI‑related demand over the course of last year.
The low volatility factor brought up the rear in 2025 at 6.0%, another slide from 2024’s fourth place showing of 22.1%. Low‑volatility trailed all other factors as falling interest rates and improving risk appetite pushed investors toward higher beta areas of the market, reducing demand for defensive and stability‑oriented names. The defensive sectors that typically anchor low‑volatility strategies, such as utilities and consumer staples, also lagged in a market that favoured growth‑oriented and more cyclically sensitive sectors last year.
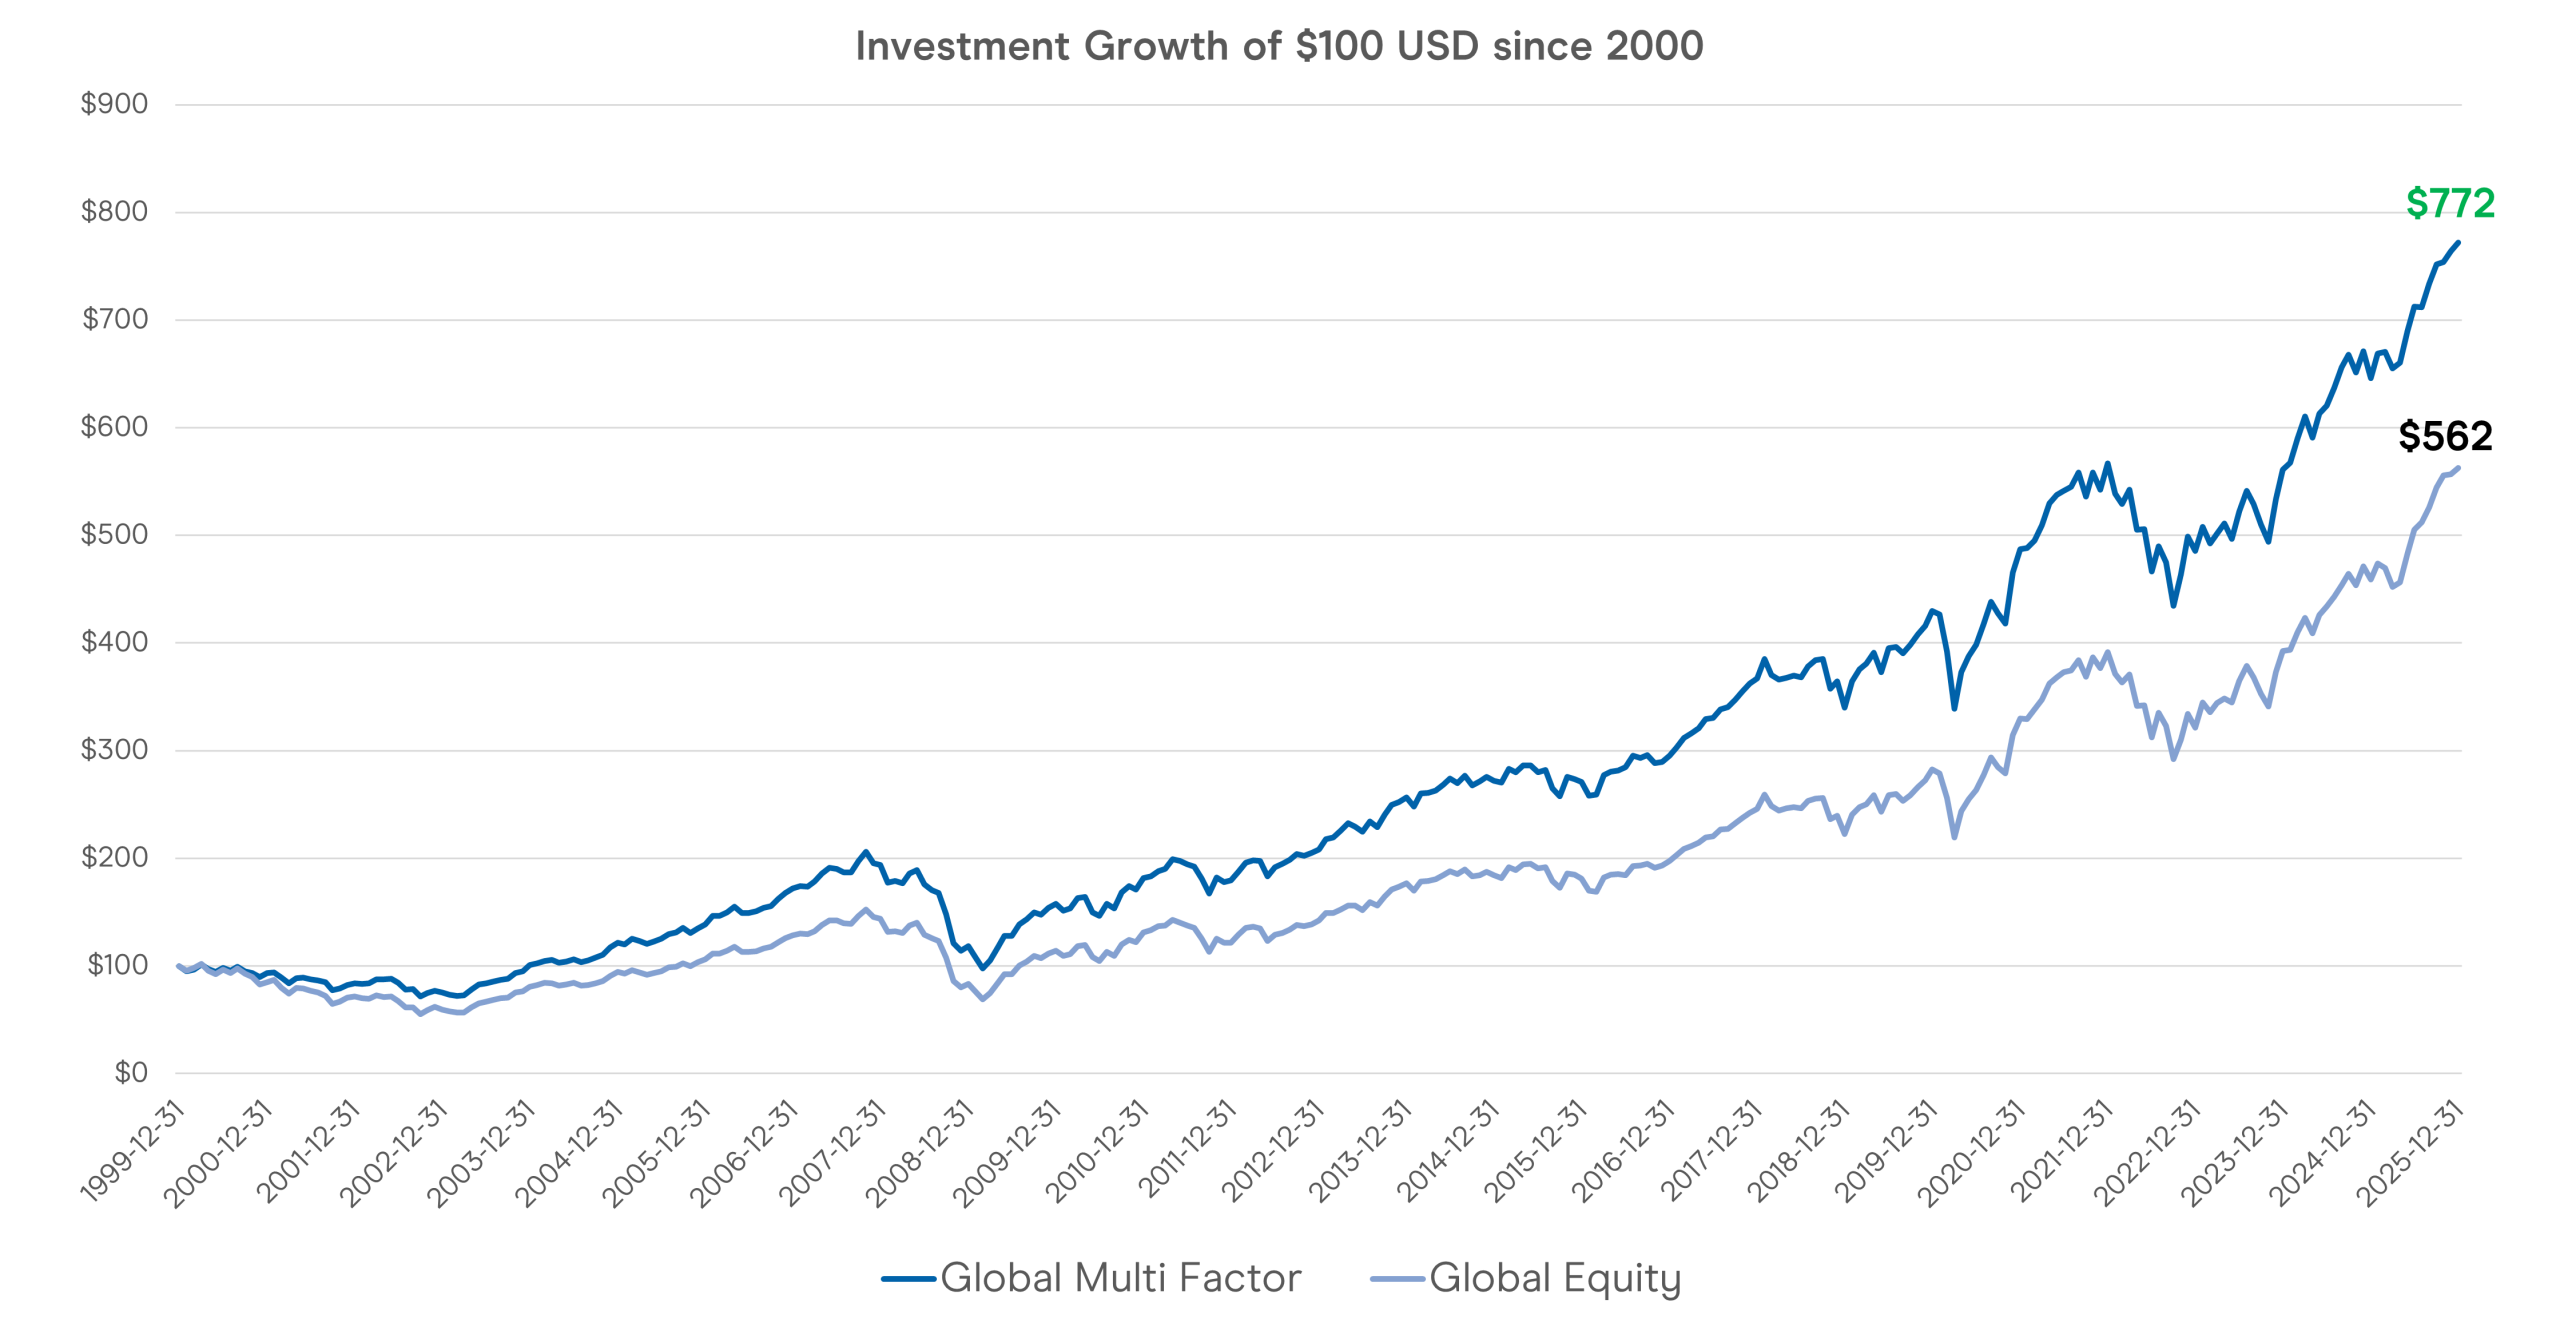
While the outperformance of any one factor in any given year is unpredictable (making “factor timing” a mug’s game) diversifying across factors and systematically rebalancing allocations can augment portfolio returns over time. As illustrated by the following graph depicting the cumulative growth of $100 USD invested since 2000, the global multi-factor portfolio has created an incredible 37% more wealth than the global broad market index (see Appendix I for the indexes used and disclaimer).
At the turn of the 21st century, “factors” were a fascinating corner of the capital markets but of little practical use to individual investors. Since then, with the advent of low-cost exchange traded funds and the creation of transparent, rules-based factor indices by a range of index providers, a multi-factor portfolio has moved from academic theory to concrete application. Patient investors finally have an empirically sound approach to pursuing market-beating returns.
Appendix I
| Global Factor/Portfolio/Market | Index (USD) |
| Momentum | MSCI ACWI Momentum |
| Quality | MSCI ACWI Quality |
| Low Volatility | MSCI ACWI Global Minimum Volatility |
| High Dividend Yield | MSCI ACWI High Dividend Yield |
| Value | 50% MSCI ACWI Large Cap Value; 50% MSCI ACWI SMID Value |
| Size | MSCI ACWI SMID Cap Index |
| Global Multi-Factor | Equal Weight of the Above 6 Factors; Rebalanced Monthly |
| Broad Market | MSCI ACWI Investable Market Index |
Disclaimer
Tacita Capital Inc. (“TCI”) is a private, independent family office and portfolio management firm that specializes in providing integrated wealth advisory and portfolio management services.
TCI research has been prepared without regard to the financial circumstances and objectives of any individual investor. The asset classes/securities/instruments/strategies discussed may not be suitable for all investors and certain investors may not be eligible to purchase or participate in some or all of them. It is not possible to invest directly in an index. Whether a particular investment or strategy is appropriate depends on individual circumstances and objectives. Investors should therefore independently evaluate particular investments and strategies or seek the advice of a financial advisor.
All investments involve risk including loss of principal. Past performance is not necessarily a guide to future performance; estimates of future performance are based on assumptions that may not be realized. Management fees and expenses are associated with investing.
TCI research is based on public information and is prepared for informational purposes. While we make every effort to use reliable, comprehensive information, we do not warrant that it is accurate or complete. We assume no obligation to inform anyone should the opinions, estimates or information provided change.
TCI research is not intended to provide tax, legal, or accounting advice. Investors should obtain their own professional advice in this regard.
Neither the information provided nor any opinion expressed in our research constitutes a solicitation by TCI for the purchase or sale of any securities or financial products.