One of the most important discoveries in finance over the past few decades is that stocks of firms that share certain fundamental characteristics called “factors” exhibit different return and risk characteristics than the overall market. Critical to investors is the fact that, over long periods of time, certain of these factors have earned excess returns compared to the overall market.
Broadly speaking, these factors can be distilled into the following categories:
- Momentum: Stocks that have exhibited positive momentum – i.e., have performed relatively well over the past 3 to 12 months have outperformed, on average, over long time horizons stocks that display negative momentum.
- Quality: Stocks that have evidenced superior profitability in relation to capital have, on average, outperformed firms with poorer profitability in relation to capital over long time horizons.
- Low Volatility: Stocks that have exhibited low volatility have, on average, outperformed stocks that display high volatility over the long run.
- High Yield: Stocks of companies that pay higher dividends, on average, have earned superior returns to lower and non-dividend paying stocks over the long run.
- Value: Stocks that are low-priced in relation to earnings, dividends, cash flow or book value, on average, have outperformed growth stocks over long time horizons.
- Size: Stocks of small and mid-size companies have earned, on average, higher returns than stocks of large companies over long time periods.
There are two primary explanations for the higher returns associated with these factors. One is that the higher returns represent risk premiums – i.e. compensation to investors for incremental risks beyond that of the total stock market. For example, small company stocks are not only more volatile than stocks of large companies but are also much less liquid. Value stocks tend to include a higher proportion of heavily indebted companies which dramatically underperform the overall market during periods of extreme market stress.
The second explanation is offered by behavioural finance. Investors’ cognitive biases such as “myopia” and “overconfidence” can lead to the persistent mispricing of certain securities. For example, many investors are attracted to the episodic outsized returns of high volatility, low quality stocks and chase these types of stocks despite a pattern of longer-term underperformance. Overly optimistic investors overestimate the earnings prospects of growth stocks while underestimating those of value stocks; value stocks then generate superior returns as investors eventually realize that earnings in the value universe are better than initially expected. The “herding” behaviour of investors has been advanced as an explanation for the returns associated with the momentum factor.
Social phenomena such as the “bandwagon effect” can also distort prices. The “madness of crowds” – as evidenced by the railway mania of the 1840’s, the Florida real estate boom of the 1920’s, the Japanese bubble of the 1980’s and the internet mania of the 1990’s – is a well-documented recurring market spectacle. Investors’ infatuation with certain extremely expensive US growth names these last several years will likely be added to the textbooks as the most recent example.
Factor performance can vary because of business cycle influences, market sentiment, interest rate changes, technological innovations, sector composition and other variables. The following chart sets out the return earned by each factor globally in 2024 compared to the overall broad market. (See Appendix I for Sources).

Momentum had an outstanding year in 2024 achieving a remarkable 44.3% return and overtaking quality, which held the top spot in 2023. Momentum was also well ahead of the broad market, which bested 2023’s 18.9% return with a bullish 27.5% in 2024. Broad market stocks saw resounding returns over the course of the year as global central banks eased interest rates and investors adopted a risk-on attitude. Momentum stood to gain the most from this attitude in 2024. Investors pursuing higher returns piled into stocks exhibiting upward trends, particularly in high-performing growth sectors like technology. Positive investor sentiment also fueled momentum thanks largely to the regime shift by global central banks.
Quality matched its performance in 2023 but fell to second place with a 30.3% return in 2024. Quality’s strong return can be chiefly attributed to US technology mega-cap stocks that continued to capitalize on the wave of AI fervour that began in 2023, while also sharing many of the gains made by the momentum factor over the course of last year. Low volatility followed lagging the broad market but posting a strong return of 22.1% relative 2023’s last place showing of 5.5%. Investors sought refuge in low vol stocks during periods of volatility for capital markets in 2024.
As a sidenote, Tacita Capital has utilized momentum and quality equity instruments as elements of a prudent broader equity approach on behalf of clients for many years.
Value and small-mid size stocks were closely behind low volatility, returning 20.5% and 19.1% respectively last year. While momentum was the star of the show, value and small-mid size factors benefited from a rotation towards value and small-cap stocks towards the end of the year driven in part by the anticipation of pro-growth policies from the newly elected U.S. president and resilient economic performance in North America. Finally, high dividend stocks brought up the rear at 18.1% in 2024 as investors’ pursuit of growth opportunities through the momentum and quality factors overshadowed high dividend stocks.
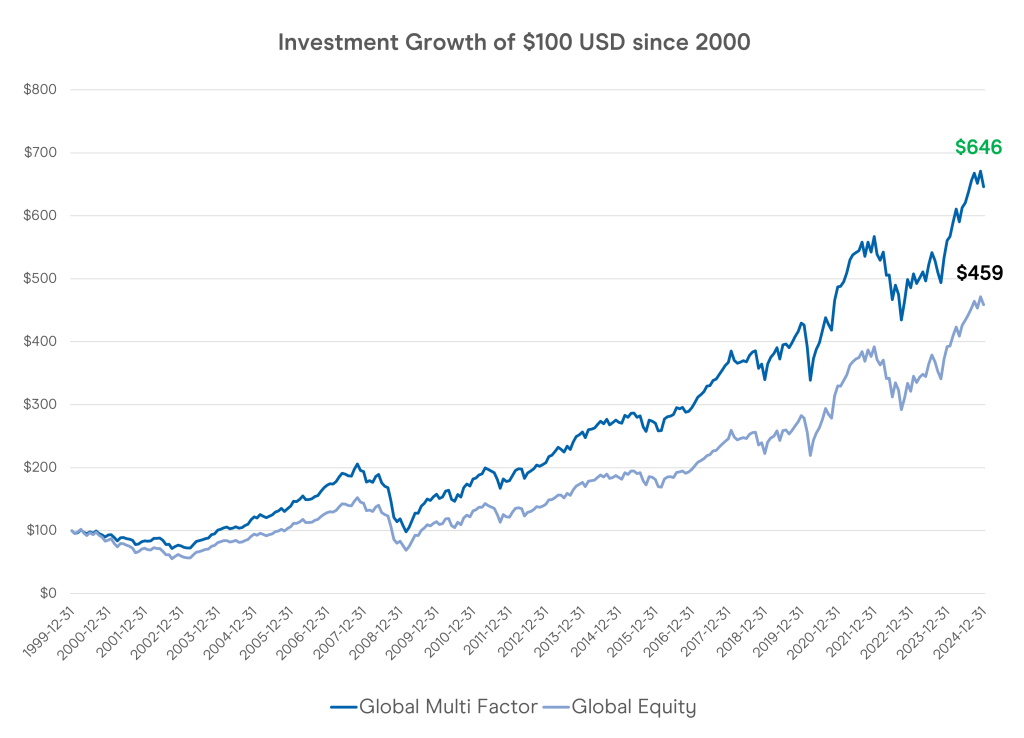
While the outperformance of any one factor in any given year is unpredictable (making “factor timing” a mug’s game) diversifying across factors and systematically rebalancing allocations can augment portfolio returns over time. As illustrated by the following graph depicting the cumulative growth of $100 USD invested since 2000, the global multi-factor portfolio has created an incredible 41% more wealth than the global broad market index (see Appendix I for the indexes used and disclaimer).
At the turn of the 21st century, “factors” were a fascinating corner of the capital markets but of little practical use to individual investors. Since then, with the advent of low-cost exchange traded funds and the creation of transparent, rules-based factor indices by a range of index providers, a multi-factor portfolio has moved from academic theory to concrete application. Patient investors finally have an empirically sound approach to pursuing market-beating returns.
Appendix I
| Global Factor/Portfolio/Market | Index (USD) |
| Momentum | MSCI ACWI Momentum |
| Quality | MSCI ACWI Quality |
| Low Volatility | MSCI ACWI Global Minimum Volatility |
| High Dividend Yield | MSCI ACWI High Dividend Yield |
| Value | 50% MSCI ACWI Large Cap Value; 50% MSCI ACWI SMID Value |
| Size | MSCI ACWI SMID Cap Index |
| Global Multi-Factor | Equal Weight of the Above 6 Factors; Rebalanced Monthly |
| Broad Market | MSCI ACWI Investable Market Index |
Disclaimer
Tacita Capital Inc. (“TCI”) is a private, independent family office and investment counselling firm that specializes in providing integrated wealth advisory and portfolio management services.
TCI research has been prepared without regard to the financial circumstances and objectives of any individual investor. The asset classes/securities/instruments/strategies discussed may not be suitable for all investors and certain investors may not be eligible to purchase or participate in some or all of them. It is not possible to invest directly in an index. Whether a particular investment or strategy is appropriate depends on individual circumstances and objectives. Investors should therefore independently evaluate particular investments and strategies or seek the advice of a financial advisor.
All investments involve risk including loss of principal. Past performance is not necessarily a guide to future performance; estimates of future performance are based on assumptions that may not be realized. Management fees and expenses are associated with investing.
TCI research is based on public information and is prepared for informational purposes. While we make every effort to use reliable, comprehensive information, we do not warrant that it is accurate or complete. We assume no obligation to inform anyone should the opinions, estimates or information provided change.
TCI research is not intended to provide tax, legal, or accounting advice. Investors should obtain their own professional advice in this regard.
Neither the information provided nor any opinion expressed in our research constitutes a solicitation by TCI for the purchase or sale of any securities or financial products.